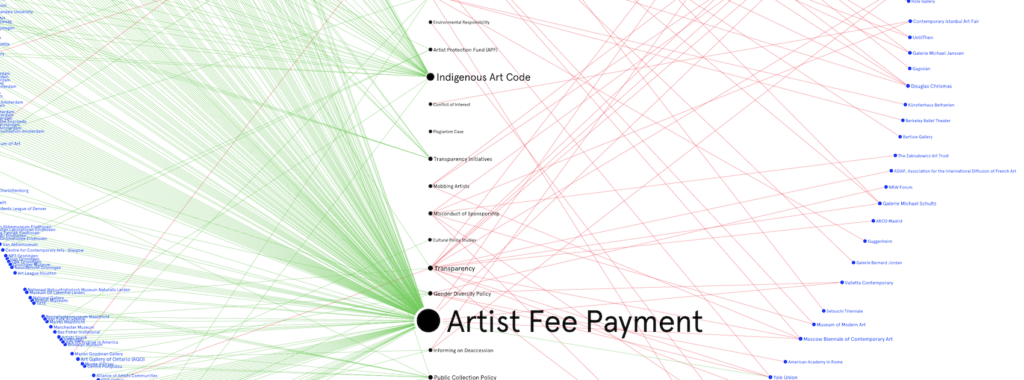
A recommendation from curator, Ph.D. Candidate Anne Julie Arnfred: try Graph Commons. which is a tool that can help you visualise large bodies of data.
I have used Graph Commons as a tool when handling a large pool of fragmented data and other research material. Getting an overview of the data helps me to get an idea of what I already have, what is missing , and what is (and might stay) uncapturable or silent.
In other words, Graph Commons works well as a processual tool for laying the ground for a research and find connections between different data assemblages.
However, you should be aware of that when forming the graph, and relating the fragments to specific other fragments, you are also creating a narrative, that can end up as un-flexible as the one you (might) did the research project to escape from.
Therefore, when using a tool such as Graph Commons, I have to continually ask myself, what the counter narrative (to the narrative I propose in the graph) would be, and recurrently try to disrupt the exact same narrative that I am building.
If it were possible to facilitate the entering of unplanned or for me unforeseen fragments to enter the graph, it wouldn´t work so much as just a new narrative, but instead work as a different way of looking at entanglements and past, presents and futures. Therefore I´m in the moment reflecting on how this could be facilitated, so please ad suggestions , if you have any.
Anne Julie’s ph.d. project Curating research – the researching art exhibition as knowledge generator explores how curating and the curatorial may contribute to scholarly research.